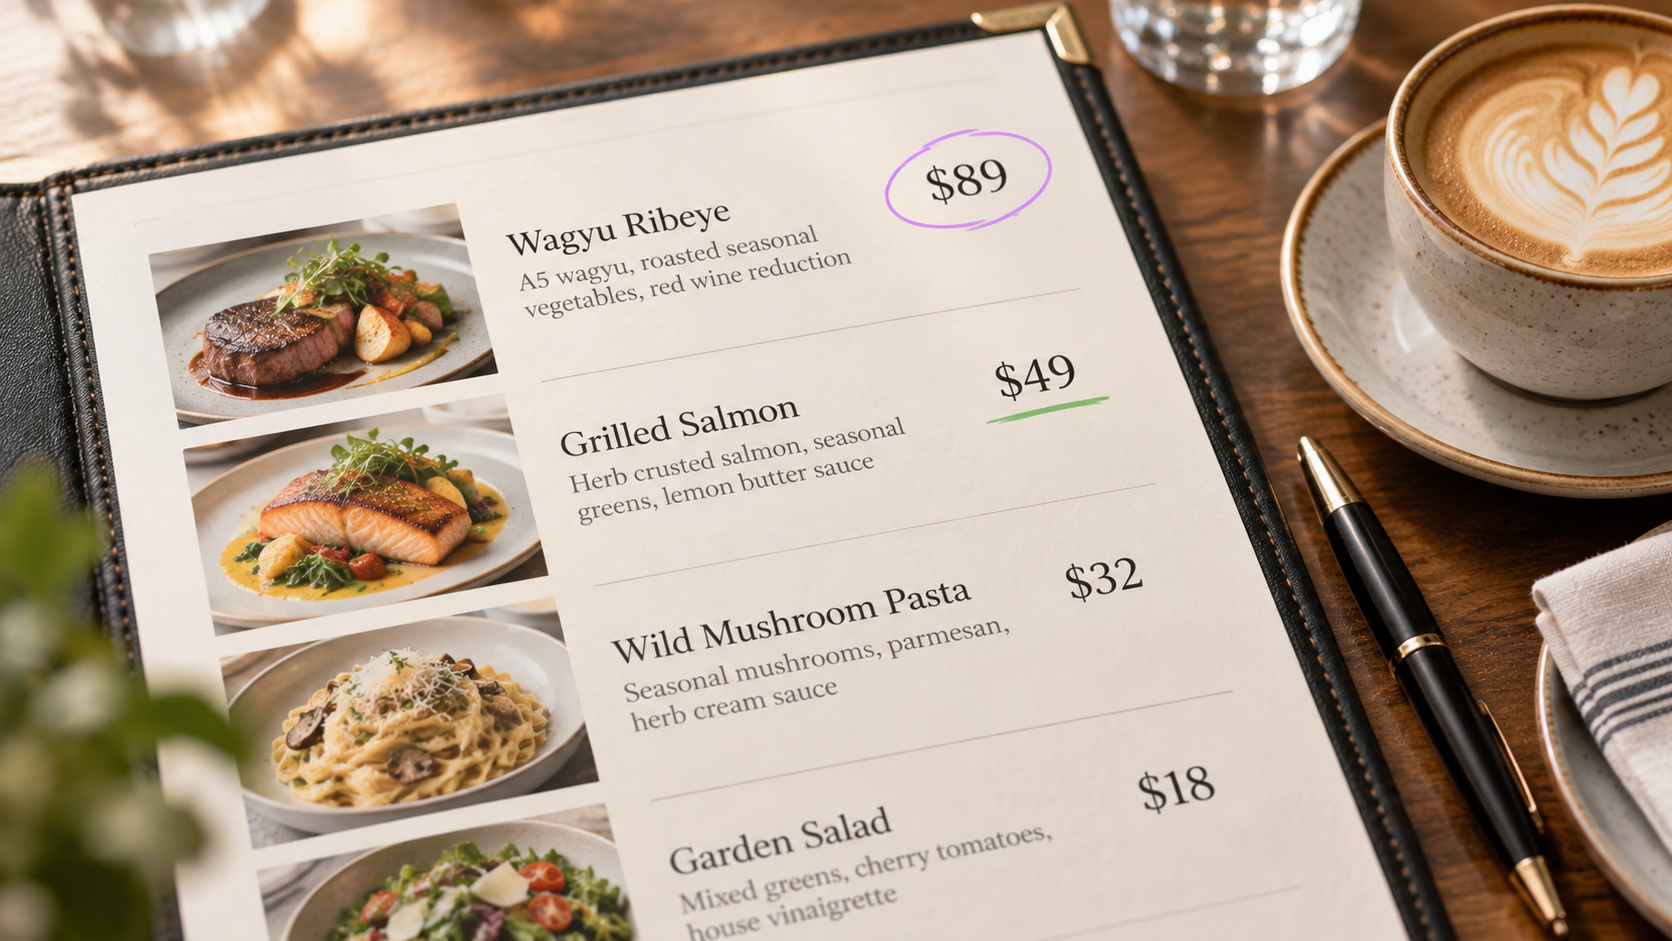
The Complete Guide to Menu Engineering: How to Build a More Profitable Menu with Data and Customer Psychology
Connexup Team
Jul 31, 2026
A restaurant's best-selling item is not always its most profitable one. A high-margin dish may still go unnoticed by customers. Other items may generate neither steady sales nor meaningful profit, yet remain on the menu and continue adding complexity to purchasing, inventory, and kitchen operations.
This is the problem menu engineering is designed to solve.
1. What Is Menu Engineering?
Menu engineering is a data-driven method that examines each item's profitability and popularity to determine which dishes to promote, which to reprice or reformulate, which to reposition, and which to remove.
This distinguishes it from traditional menu design. The latter focuses on color, typography, photography, layout, and brand aesthetics—asking whether the menu is clear and visually appealing. Menu engineering goes further, examining sales, costs, profit contributions, and customer decision patterns to ask whether the menu supports the restaurant's broader business goals.
The key difference lies in the starting point: menu design begins with visuals; menu engineering begins with data. Restaurants should first decide which items they want customers to choose, then use names, descriptions, placement, images, and recommendation labels to guide those choices.
2. Why Do Restaurants Need Menu Engineering?
Many restaurants update their menus regularly without truly analyzing how each item performs. When a new dish launches, the team may focus only on sales. When ingredient prices rise, the immediate response may be to increase prices across the board. An underperforming item may remain on the menu simply because the owner personally likes it.
These decisions may appear harmless, but over time they can steadily erode profit.
Menu engineering provides three core benefits:
It identifies the items that truly contribute to profit. High sales do not always mean high profit. Items with expensive ingredients, oversized portions, or excessive waste may contribute far less than expected. Meanwhile, items with moderate sales, stable costs, and efficient preparation may generate more profit overall.
It prevents indiscriminate price increases. Different menu items play different business roles. Some attract customers, some generate profit, and others provide variety. Raising every price at once may damage the very products that bring customers through the door.
It simplifies the menu and improves efficiency. Removing ineffective options can improve purchasing and inventory management, reduce food waste, and make ordering easier for customers. A strong menu does not offer the most choices. It meets core customer needs while helping guests quickly find the right items.
3. The Traditional Four-Category Matrix Framework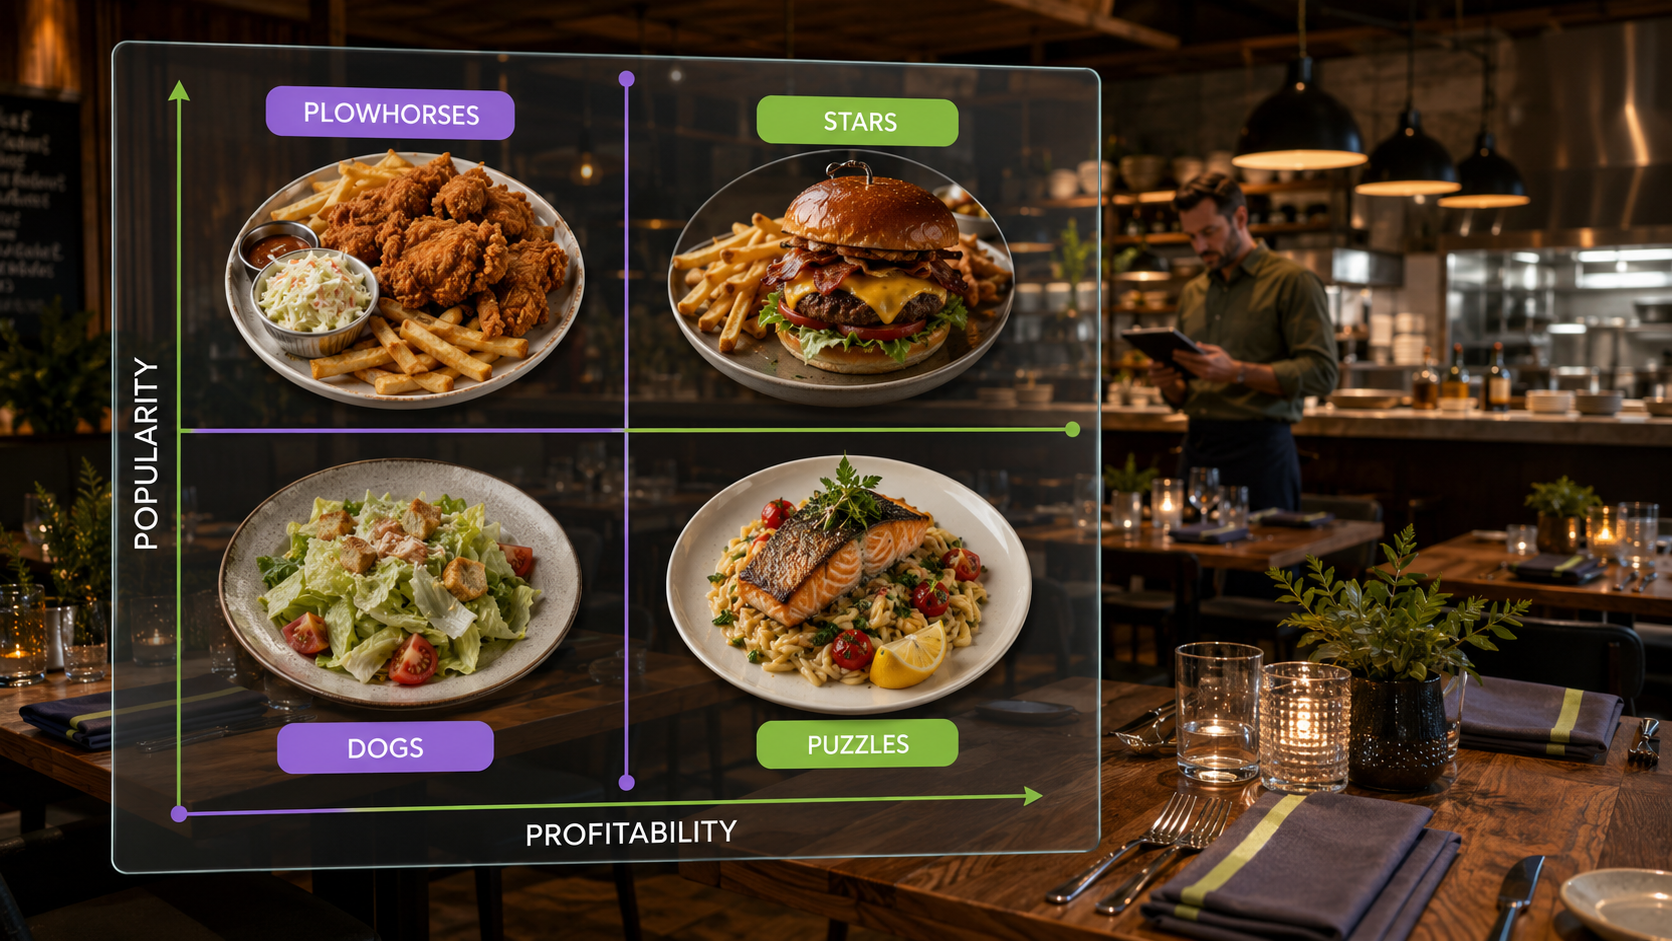
Traditional menu engineering evaluates items across two dimensions: profitability, meaning how much profit each item contributes, and popularity, meaning how frequently customers order it.
Profitability can be measured through gross margin, contribution margin per item, and fully loaded cost. Popularity can be evaluated through sales volume, sales mix, and the item's share of orders within its category.
Main courses, drinks, desserts, and sides should be analyzed separately because they follow different ordering patterns. Comparing all categories directly can easily produce misleading conclusions.
Based on profitability and popularity, menu items fall into four categories:
Menu Item Category | Profitability | Popularity | Core Strategy |
|---|---|---|---|
Stars | High, with a reference point above 70% | High, representing more than 15% of sales | Promote and maintain |
Plowhorses | Low, with a reference point below 60% | High, representing more than 15% of sales | Optimize costs, portions, or pricing |
Puzzles | High, with a reference point above 70% | Low, representing less than 10% of sales | Reposition and improve visibility |
Dogs | Low, with a reference point below 60% | Low, representing less than 10% of sales | Adjust, replace, or remove |
These percentages should be treated as starting points rather than fixed standards for every restaurant. Items with margins between 60% and 70%, or sales shares between 10% and 15%, can be placed in an observation group and evaluated according to the restaurant's concept, average check size, and stage of development.
Stars: High Profitability, High Popularity
Stars have already been validated by the market and generate steady profit. They are the items most deserving of marketing attention, but the goal should be to maintain their quality, portion size, and consistency rather than changing them too often.
Restaurants can place Stars in prominent areas of the menu, use accurate labels such as "Signature" or "Best Seller," and make them a priority in staff recommendations. Across digital channels, Stars can become the centerpiece of advertising, social content, and meal bundles.
To create more value from these items, restaurants can build complementary products around them. Any price increase, however, should be tested gradually rather than introduced all at once.
Plowhorses: Low Profitability, High Popularity
Plowhorses sell consistently but provide limited profit. The problem may come from oversized portions, expensive ingredients, excessive waste, or prices that have not changed for a long time. However, these items are often a major reason customers choose the restaurant, so operators must balance profitability with guest expectations.
Start by reviewing plate waste. If customers regularly leave part of the dish unfinished, a modest portion reduction may lower costs while also reducing waste. Expensive ingredients can be replaced with comparable, more stable alternatives, or their usable yield can be improved through standardized preparation.
A small price increase may also help. Another option is to pair Plowhorses with high-margin drinks or sides. This can improve the profitability of the overall order without removing an item customers already know and enjoy.
Puzzles: High Profitability, Low Popularity
Puzzles offer strong profit potential but do not generate enough sales. The problem is often not the product itself. Customers may not notice it, understand it, or recognize its value.
Restaurants should review the item's name, description, photography, placement, and staff recommendations. An abstract name can make a dish difficult to understand. A description that simply lists ingredients, without explaining the cooking method, flavor, or defining features, may fail to create interest. On digital menus, unclear or unappealing photos can also affect ordering decisions.
Puzzles can gain more exposure through labels such as "Chef's Recommendation," limited-time promotions, bundles, or staff suggestions. If price is the main barrier, restaurants can test a smaller portion, an entry-level option, or a modest price adjustment. Removal should only be considered after several improvement attempts fail to produce results.
Dogs: Low Profitability, Low Popularity
Dogs generate little profit and receive few orders, making them the most obvious candidates for menu reduction. They take up menu space while adding ingredients, inventory pressure, and kitchen complexity.
However, low profit and low popularity do not always justify immediate removal. Some items help use ingredients left over from other dishes. Others serve vegetarian diners, children, or customers with specific dietary needs. Some may also support the restaurant's brand identity.
Operators should first determine whether the item has another strategic purpose. If not, they can adjust the recipe, portion, or price, or move the item to a seasonal menu for further testing. If performance still does not improve, it can be replaced by a stronger Star or Puzzle.
4. Menu Engineering Priorities at Different Stages of Restaurant Growth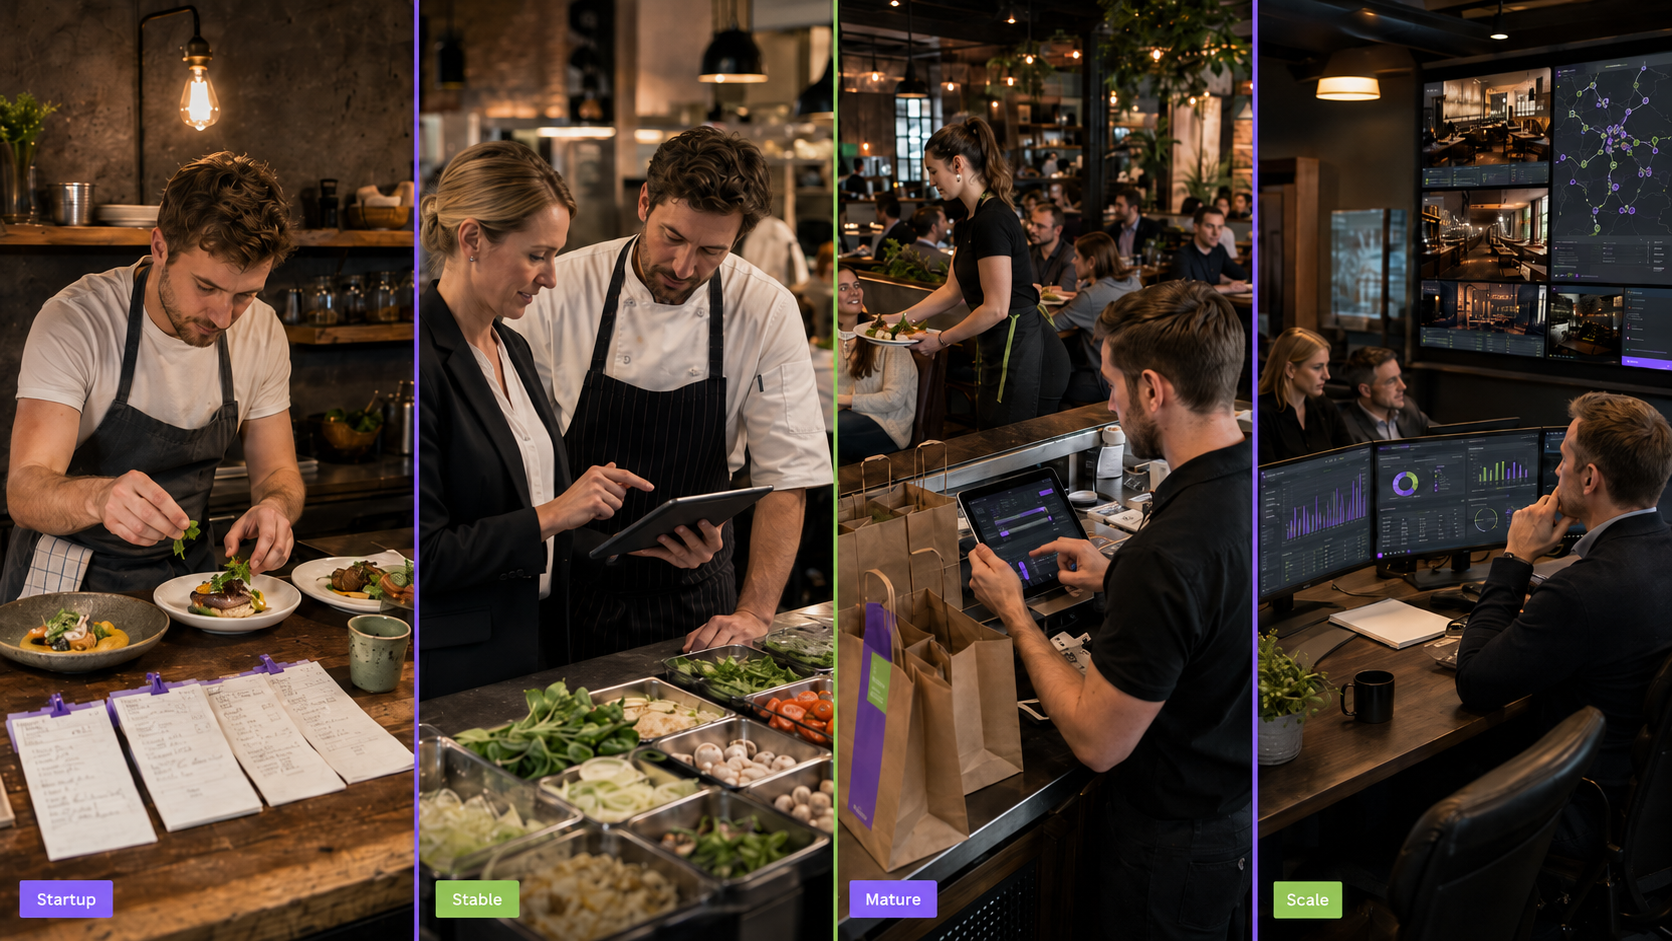
Restaurants face very different challenges at different stages. Startups need to validate demand. Stable restaurants need to improve profitability. Mature brands need more precise segmentation, while expanding businesses must solve standardization and replication challenges.
Menu engineering priorities should change accordingly.
Startup and Exploration Stage: Find Two or Three Core Items
At this stage, restaurants should not aim for a large, all-inclusive menu. A long product line spreads limited sales data across too many items while increasing purchasing, inventory, and training complexity.
Operators can take the following actions:
Limit the total number of items and prioritize dishes that share core ingredients and preparation processes. Reduce the number of specialized ingredients and complicated procedures.
Create a basic cost sheet for every item, recording its selling price, cost per serving, sales volume, and repeat-order rate.
Use a four- to eight-week observation period to identify early core-item candidates with stable profit and repeat-purchase performance.
Concentrate resources on developing two or three Stars. Create standardized recipes, portion sizes, plating images, and staff descriptions for each one.
Remove items that remain low in both profitability and sales for two consecutive review periods and have no other strategic value.
Collect weekly feedback from front-of-house and kitchen teams. Pay attention to which items customers frequently ask about, leave unfinished, or complain about.
At this stage, the goal is not to create a perfectly balanced four-quadrant menu. It is to validate market demand quickly and retain the items that truly deserve further investment.
Stable Development Stage: Focus on Plowhorses and Puzzles
Once a restaurant has established a customer base and developed several Stars, the menu engineering priority should shift from finding viable items to improving the overall profit structure.
Operators should:
Update the cost of major ingredients every month so supplier price changes do not quietly erode margins.
Rebuild the four-quadrant matrix every quarter to monitor how items move between categories.
Test one variable at a time for Plowhorses. Adjust portion size first, then test price, rather than changing several factors at once and losing the ability to identify what caused the result.
Set a defined promotional test period for Puzzles. Test new names, improved placement, or stronger recommendations to increase visibility.
Review whether high-volume main dishes drive sales of drinks, sides, and desserts. Use thoughtful combinations to improve profit per order.
Maintain a menu change log that records the timing, details, and results of every adjustment. This prevents teams from repeating tests that have already failed.
Local Maturity Stage: Move from Item-Level Analysis to Customer and Occasion Segmentation
Once a restaurant has established local awareness and a stable customer base, overall sales data alone is no longer enough to support more precise decisions. Performance should be broken down by customer group, ordering channel, and dining occasion.
Operators should:
Analyze lunch and dinner, weekdays and weekends, and dine-in and delivery separately. This helps identify items that only work in specific situations.
Compare the preferences of new and returning customers. Clarify which items attract first-time visits and which encourage repeat business.
When testing price, bundle, or placement changes, keep a control period or control location so short-term fluctuations do not distort the results.
Analyze cross-purchase behavior to improve bundles and add-on prompts.
Include reviews, returned dishes, plate waste, and staff feedback in the evaluation process so the reasons behind the numbers become clearer.
At this stage, menu engineering is no longer limited to deciding whether an item should stay or go. It is about giving each item a clearer role across different times, channels, and customer groups.
Expansion and Transformation Stage: Turn a Successful Menu into a Replicable System
A menu that performs well in one location cannot always be copied directly into another. Before expansion, each item must be tested against supply chain conditions, equipment requirements, training needs, preparation efficiency, and consistency.
Operators should focus on the following:
Add proven Stars to the core menu and standardize recipes, ingredient specifications, portion sizes, preparation steps, plating standards, and acceptable cost ranges.
Establish substitution rules for key ingredients, clearly identifying what can be replaced and what must remain unchanged.
Pilot the menu in selected locations before a full rollout. Test supply chain reliability, training effectiveness, and customer acceptance.
Establish consistent data definitions so every location calculates costs, sales, and profit contribution in the same way.
Review performance regularly to determine whether Stars have changed categories because of regional costs or execution differences.
Leave limited room for local items within the standardized core menu, but require every local item to follow the same testing process.
The ultimate goal at this stage is to turn the success of one location into a menu system that every location can execute consistently. Profitability should no longer depend on a particular chef, manager, or store.
5. The Advanced Five-Stage Menu Engineering Framework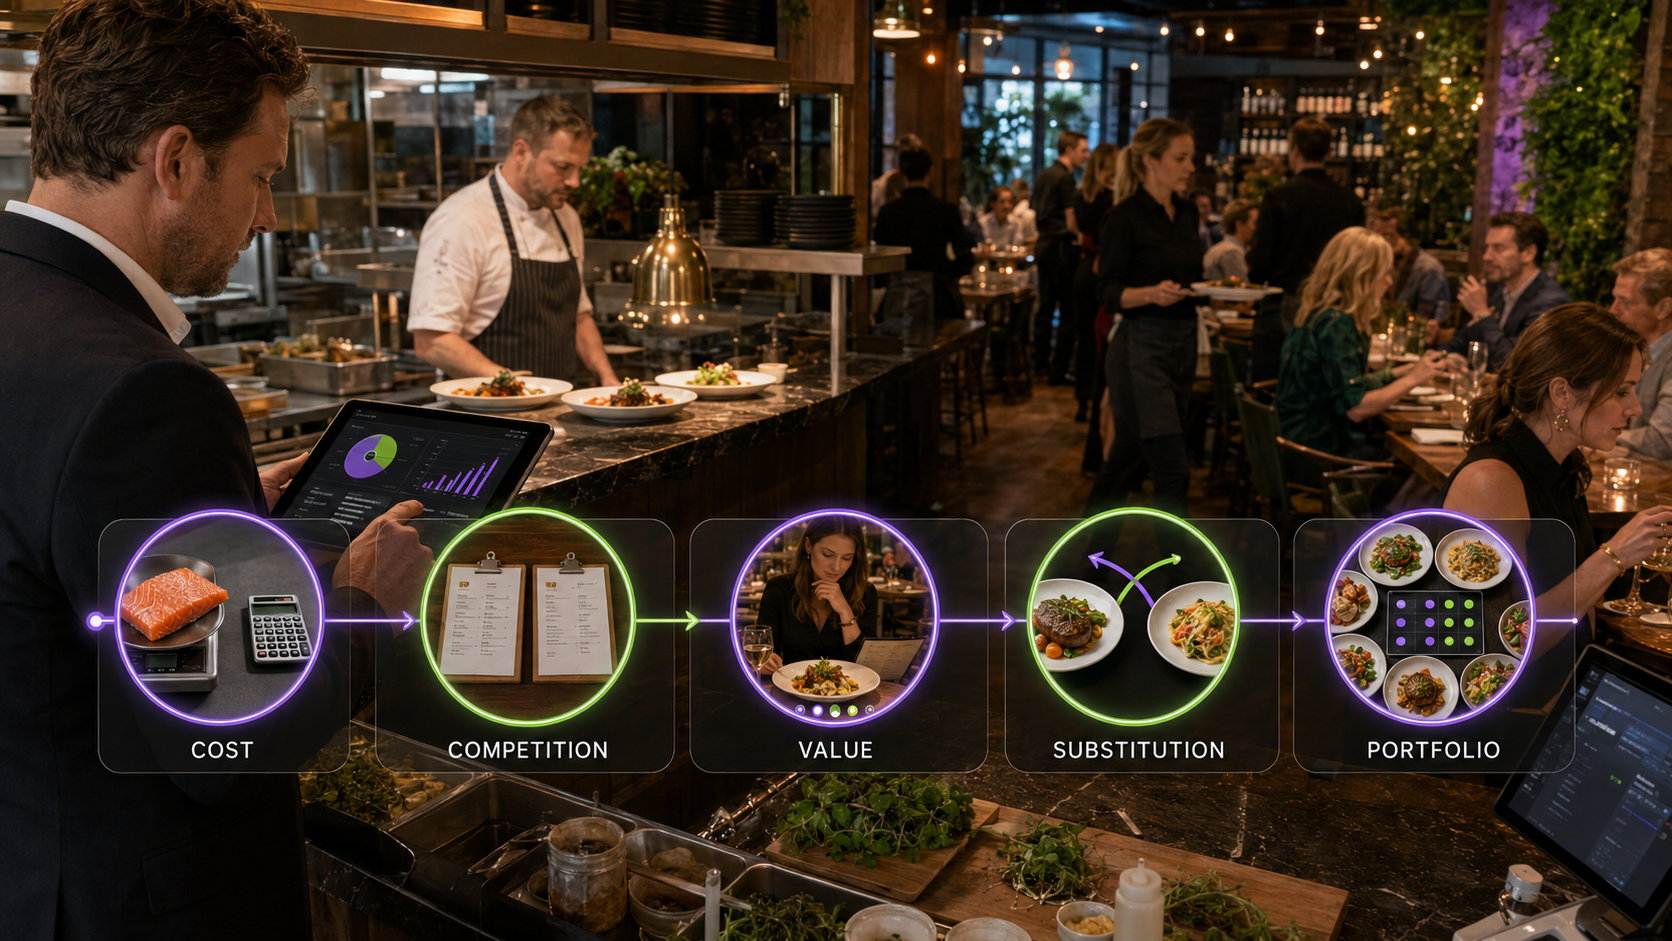
The four-quadrant matrix can diagnose how an item is performing, but it cannot explain why the item is in that position. To develop more precise strategies, operators need to analyze cost, competition, customer value perception, substitution effects, and overall portfolio structure.
Stage 1: Cost Foundation Analysis
Understanding the true profitability of each item requires restaurants to distinguish between direct food cost and fully loaded item cost.
Direct food cost includes ingredients, seasonings, packaging, and waste. Fully loaded cost also includes direct labor, allocated operating expenses, and other related costs.
The core formulas are:
Contribution Margin per Item = Selling Price − Direct Cost per Serving
Food Cost Percentage = Food Cost per Serving ÷ Selling Price
Restaurants often use 28% to 35% as a reference range for food cost percentage. However, restaurant concepts, rent, labor structures, and stages of development vary significantly, so this range should not be applied mechanically.
Usable yield must also be included in cost calculations. Purchasing one kilogram of beef does not mean the entire kilogram can be sold. Trimming, cooking, and storage losses all affect the actual cost. Ingredients shared across several dishes should be allocated according to actual usage so that the cost of any one item is not understated.
Stage 2: Competitive Context Analysis
An item that performs well internally may still be uncompetitive in the market. Restaurants should compare the price, portion size, ingredients, features, and overall experience of similar products offered by competitors.
Competitive analysis does not mean matching every competitor's price. If an item offers clear advantages in ingredients, preparation, service, or brand experience, the restaurant may be able to maintain a higher price. If the product lacks distinction, even a lower price may not be enough to attract customers.
At this stage, operators need to answer two questions: Compared with competitors, are customers receiving enough value? Beyond price, does the item offer a clear and credible reason to choose it?
Stage 3: Customer Value Perception Analysis
Customers do not use a restaurant's cost sheet to decide whether a dish is worth buying. They care more about portion size, flavor, ingredients, visual presentation, trust in the brand, and the overall experience. Higher internal costs do not automatically make customers willing to pay more.
Restaurants need to use guest feedback, ordering behavior, and price testing to understand actual willingness to pay. Basic, standard, and upgraded versions can create a clear pricing structure for different budgets. A premium signature item can also establish a reference point that makes the value of core items easier to understand.
However, pricing must be supported by real value. If customers cannot see a corresponding improvement in ingredients, portion size, or experience after a price increase, the result may be a loss of trust.
Stage 4: Substitution and Cross-Item Impact Analysis
Menu items do not perform in isolation. A new item may fail to generate incremental demand and simply take orders away from an existing high-margin product. Another dish may appear less profitable on its own but drive sales of drinks, desserts, or sides. A popular item may require specialized ingredients that increase inventory and waste.
Operators should analyze competition between items within the same category, cross-category purchasing behavior, and bundle performance. The key question is not simply how much a new item sold, but whether it created additional revenue or merely shifted existing sales.
Bundles should not be evaluated only by average check size. A bundle that raises the check while reducing contribution margin is not necessarily successful. The ideal combination improves profit per order while still giving customers a clear sense of value.
Stage 5: Menu Portfolio Optimization
Menu portfolio optimization means finding the right balance between revenue, profitability, customer satisfaction, and operational efficiency. The best menu does not necessarily contain the greatest number of Stars. It gives every item a clear business role:
Stars build brand recognition and contribute profit.
Plowhorses meet core customer needs or attract traffic.
Puzzles create opportunities for growth.
Some average-performing items may provide variety, meet specialized needs, or improve the value of bundles.
Final decisions should not focus only on maximizing the profit of an individual dish. Restaurants must also consider total revenue, ingredient utilization, operational efficiency, customer experience, and future scalability.
6. How to Apply Customer Decision Psychology to a Menu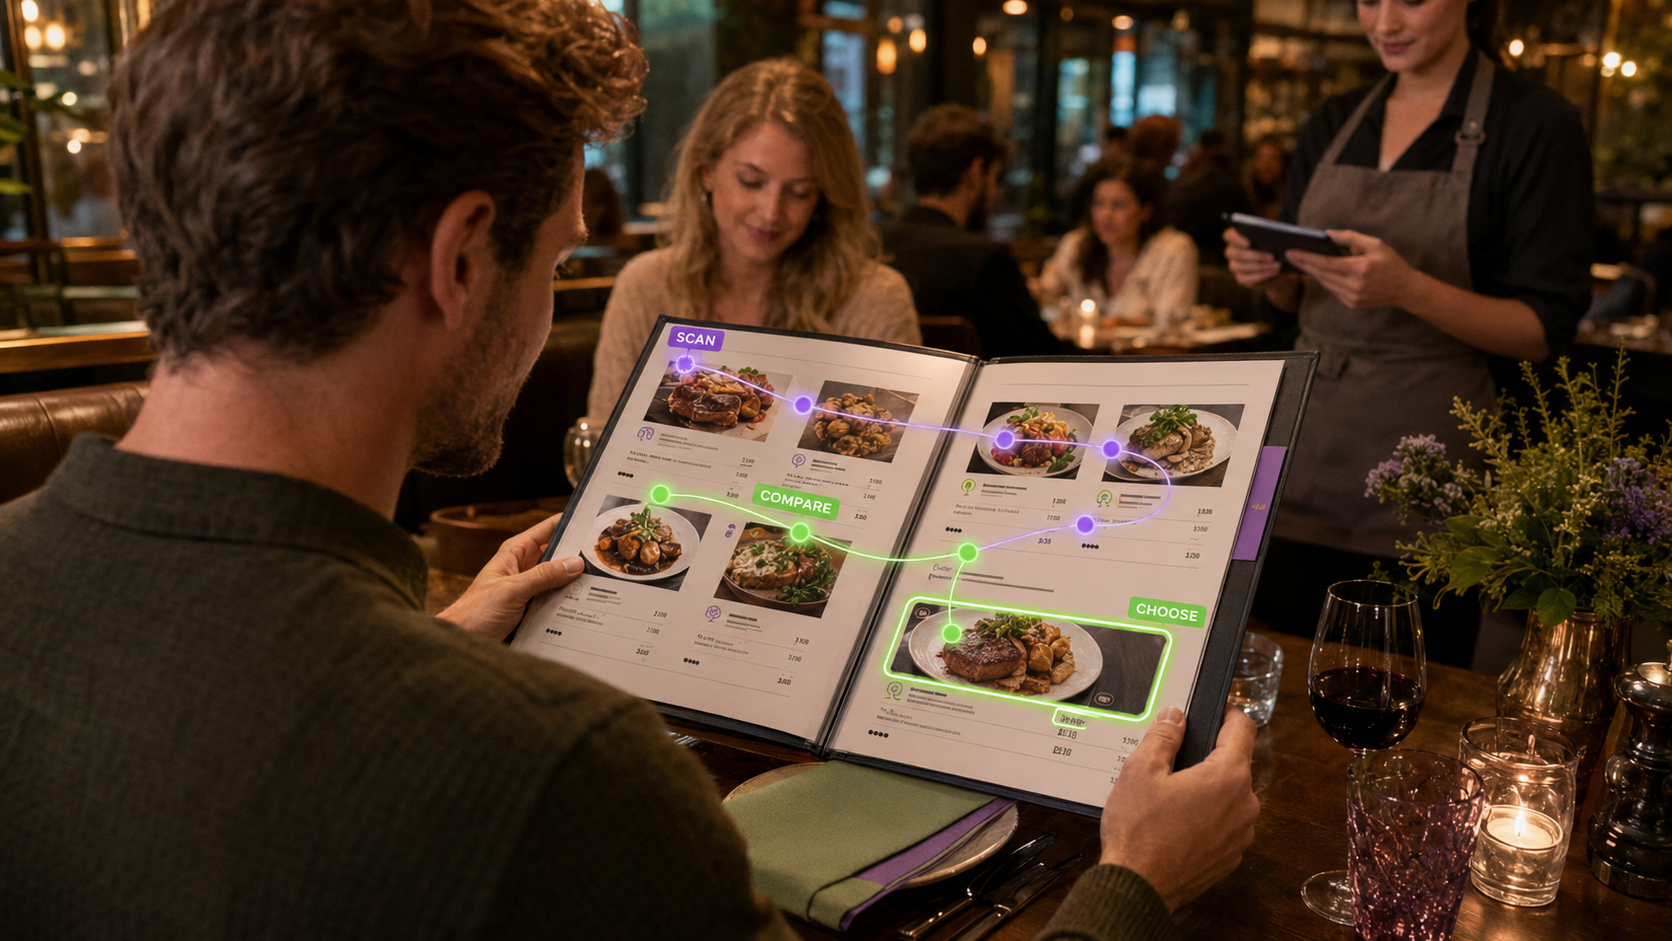
Customers usually make menu decisions in two steps. First, they scan the menu quickly and form an initial preference based on placement, images, names, and recommendation labels. If they are still unsure, they begin comparing price, portion size, ingredients, and overall value.
An effective menu should therefore help customers notice important items quickly, then provide enough information to confirm their choice. Restaurants do not need to overload the process with psychological terminology. They simply need to design around how customers actually read and order.
Use Price References to Clarify Value
Customers compare prices across the menu to decide whether an item feels expensive or reasonable. A clear structure of basic, standard, and upgraded options can provide useful reference points. A genuinely premium signature item can also make the value of other core products easier to understand.
Premium items must be supported by stronger ingredients, larger portions, distinctive preparation, or a better experience. Creating an expensive option purely to influence price perception may instead make customers question the restaurant's overall pricing.
Use Limited Availability to Encourage Interested Customers to Act
Seasonal items, limited service periods, and "while supplies last" messaging can help customers who are already interested make a decision more quickly. This approach is especially suitable for seasonal ingredients, products with limited availability, or dishes that require advance preparation.
Restaurants should not rely on false urgency. If a "last chance" offer appears throughout the year, short-term pressure will eventually weaken customer trust.
Use Genuine Popularity Signals to Reduce Decision Difficulty
When customers are unsure what to order, they often look to what other guests choose. Labels such as "Best Seller," "Customer Favorite," and "Chef's Recommendation" can make decisions easier while drawing attention to Stars and Puzzles.
These labels should reflect actual sales performance or a clearly defined product strategy. They should also be used sparingly. If most of the menu is marked as recommended, the labels lose their meaning.
Reduce Unnecessary Choices and Make Priorities Clear
More options do not always create a better guest experience. A large number of similar products increases comparison time and makes it harder for high-priority items to stand out.
Restaurants can combine highly similar items and use flavor, portion, or add-on choices instead of listing multiple nearly identical products. Each category should highlight only a few priority items, while main dishes, sides, drinks, and desserts should follow the natural ordering sequence.
This structure improves ordering efficiency while also creating more opportunities for bundles and add-ons.
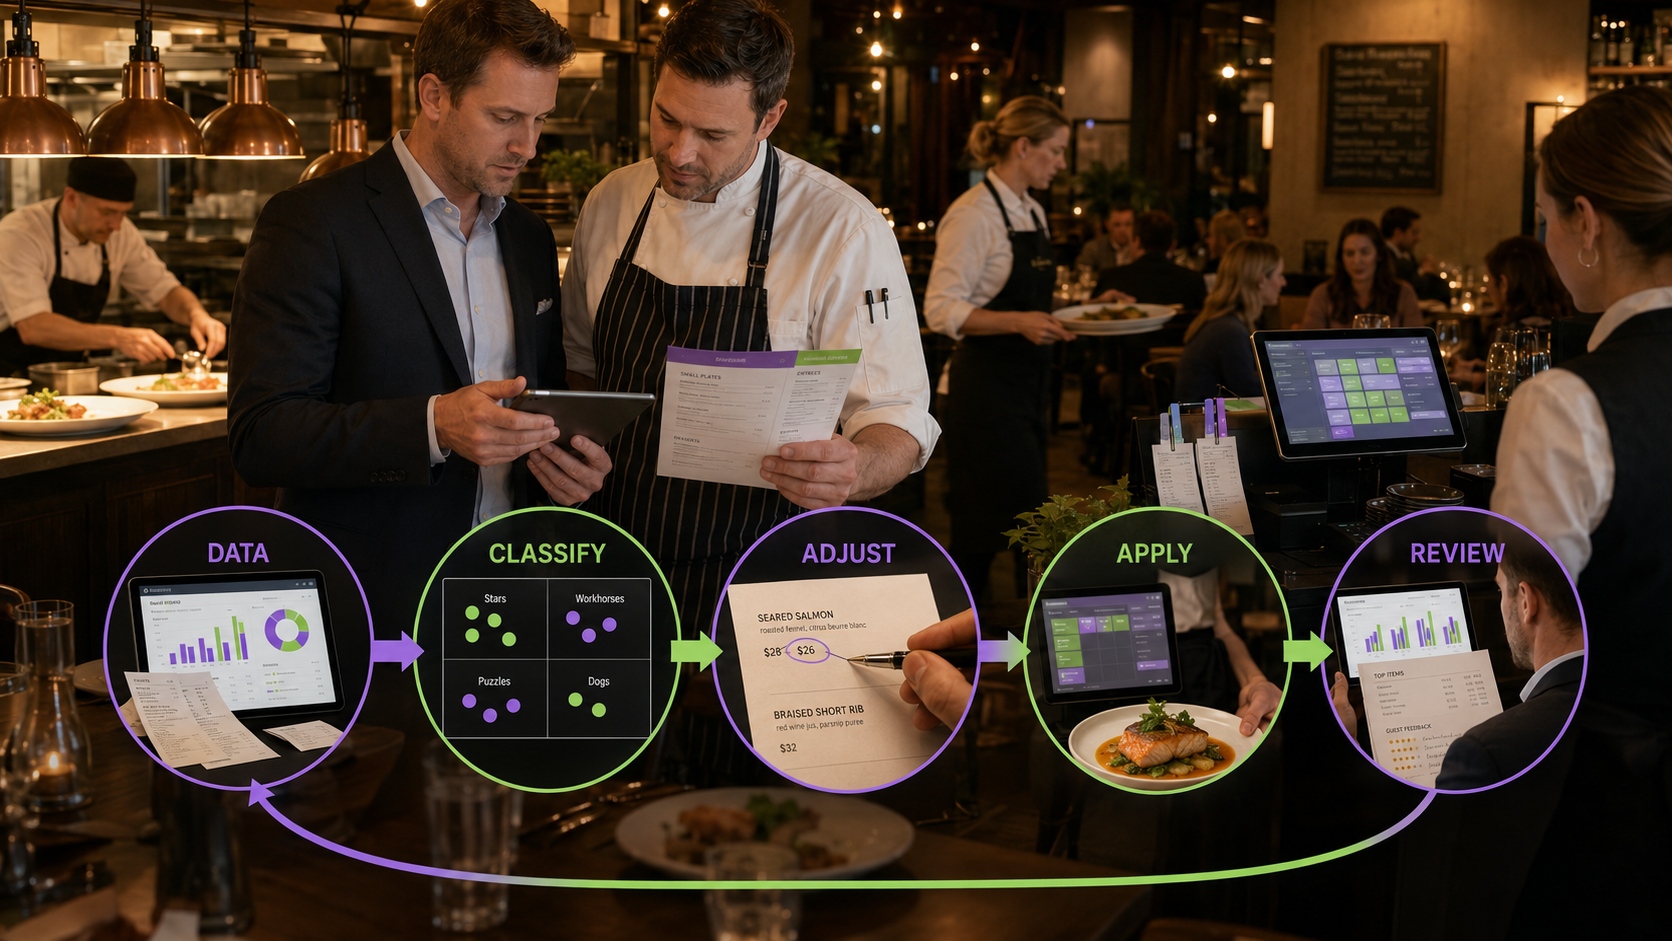
7. How to Run a Complete Menu Engineering Project
Menu engineering should follow a complete cycle:
Data collection → Item classification → Strategy development → Implementation → Performance measurement
It should not be treated as a one-time menu redesign.
Step 1: Define the Analysis Period
Select four to eight weeks of representative operating data. Exclude unusual periods such as opening promotions, major holidays, or large discount campaigns. Restaurants with strong seasonality should compare data from the same season or similar operating conditions.
Step 2: Organize Menu Item Data
Record the selling price, sales volume, revenue, direct cost, contribution margin, discounts, and complimentary items for every product. Separate dine-in and delivery data. For items that share ingredients, verify actual usage and usable yield.
Step 3: Build the Four-Quadrant Matrix
Classify items as Stars, Plowhorses, Puzzles, Dogs, or observation items. Once the initial classification is complete, use competitive context, customer value perception, and cross-item relationships to explain why each product performs the way it does.
Step 4: Create an Adjustment Plan
Variables may include recipes, portions, prices, names, descriptions, images, menu placement, bundles, staff recommendations, and promotional methods.
To measure results accurately, avoid changing too many variables in the same test.
Step 5: Update Physical and Digital Menus
Physical and digital menus serve different ordering situations and should not simply duplicate one another.
Physical menus need controlled information density, clear reading hierarchy, and alignment with staff recommendations. Digital menus need to work smoothly on mobile devices and provide clear images, size or format options, and relevant add-ons.
Step 6: Review Performance Continuously
Restaurants should continue tracking sales mix, contribution margin per item, total profit, average check size, bundle conversion, cross-purchase rates, food waste, customer feedback, and preparation efficiency.
If an adjustment increases sales but reduces overall profit or adds pressure to kitchen operations, it should not automatically be considered successful.
8. The Most Common Menu Engineering Mistakes
One of the most common mistakes is focusing on sales while ignoring profit. High sales can make an item appear successful, but they do not guarantee meaningful returns. Another common mistake is looking only at gross margin percentage without considering contribution margin per item or total sales volume. A high-margin item with very low sales may have little impact on overall profitability.
Inconsistent cost definitions can also distort decisions. Food cost and fully loaded item cost are not the same. If different team members use different calculation methods, meaningful comparisons between items become impossible. Restaurants should also avoid applying the same profitability and popularity thresholds to every category, location, and stage of growth.
Product decisions can become equally problematic when operators remove every Dog immediately or raise the price of every Plowhorse. Menu items may serve other purposes, such as attracting customers, representing the brand, using shared ingredients, or meeting the needs of specific customer groups. Final decisions should therefore reflect the item's broader business value.
Visual over-optimization is another risk. Too many labels, photos, borders, and highlighted colors can make it impossible for customers to identify the real priorities. Menu engineering is not about manipulating customers. It is about creating a clearer menu structure and presenting information in a way that helps guests find the right choice more quickly.
Conclusion: Menu Engineering Is a Continuous Optimization System
The value of menu engineering goes beyond identifying a few best-selling items. It creates a system for continuously understanding the relationship between menu items, customers, and profit.
The four-quadrant matrix helps restaurants identify current performance. The five-stage framework helps teams understand what is causing that performance. Customer decision analysis helps turn business strategy into more natural and effective ordering guidance.
A truly effective menu is not the one with the most items, nor is it the one in which every dish has the highest possible margin. It balances customer needs, brand positioning, operational efficiency, and profitability while giving every item a clear role.
When restaurants continuously track costs, sales, customer feedback, and relationships between menu items, the menu stops being a static price list. It becomes an operating system that can be tested, refined, and replicated over time.
For most restaurant operators, the real challenge is not understanding the four quadrants. It is consistently collecting reliable menu and order data, then turning those insights into better menu structure, item descriptions, product combinations, and ordering experiences across different channels.
Connexup brings menu data, order data, and guest ordering behavior into one connected operating system. It helps restaurants identify overlooked high-value items, hidden profit leaks, and pricing or positioning issues, then apply those insights to online ordering, smart recommendations, bundles, and add-ons.
As a result, menu engineering can move beyond a periodic manual project and become a data-driven operating process that restaurants can continuously test, measure, and improve.